Visualize and Analyze your Field Data in Power BI Using rIoT Technology
- Rod Nafisi
- Sep 30, 2016
- 3 min read
What is rIoT Technology: rIoT Technology is an advanced cloud interface technology that allows you to collect your real-time process data securely and makes it available anywhere and anytime. For more information, please visit www.avistarts.com
What is Power BI: Power BI, a product of Microsoft, is a cloud-based business analytics service that enables anyone to visualize and analyze data with greater speed, efficiency, and understanding. It connects users to a broad range of data through easy-to-use dashboards, interactive reports, and compelling visualizations that bring data to life. For more information, please visit www.powerbi.com
rIoT Technology provides Open Data Adaptors to acquire process data from a variety of the data sources. Data sources can range from a single sensor to a large SCADA or BMS system. The data acquired from the process is duplicated on the cloud services via rIoT Open REST Interface or Open Time Series Servers. rIoT engine uses a secure key to communicate to the cloud services and all the communications are encrypted on the fly.
Using rIoT Technology Open REST Interface, process and field data can be pushed to Microsoft Power BI. In this tutorial, we show how process data can be pushed into Power BI and used for further analytics.
Step 1: Define the data source in rIoT Explorer. For this demo, we use the simulation driver. We define two points as the data sources: Point 1: Alternate between 0 and 100 and Point 2: Random values between 0 and 100. Please note that the data source can be similarly defined via MODBUS TCP (to connect to the meters, PLCs, etc.) or via OPC client (to connect to SCADA, BMS, PLCs, etc.)
Step 2: Define the streams in Power BI: In order to send data to Power BI, we need to define Streaming datasets to receive field data. Picture below shows the required definitions for the Streaming dataset at Power BI. Once the dataset is created, copy the dataset Push URL

Step 3: Define a new Power BI endpoint in rIoT Explorer and insert the Push URL information.

As the next step, add the source points to the REST endpoint definition. In the picture below, a point by the name of Ramp 00000 is being added.

Pictures below show the two REST endpoints and corresponding source points (simulation points):


Step 4: Save the configuration, connect to the rIoT Engine and download. The data will start populating in Power BI is just a few seconds. Enjoy analyzing your data in Power BI!
Important Notes
As mentioned, data source can be MODBUS TCP Server (Sensors, Meter, RTUs, PLCs, etc.) or OPC Server (SCADA, BMS, PLCs etc.). We are adding new Data Adaptors to our collection constantly. Please contact us if your field device does not support MODBUS or OPC. We will work with you to incorporate your device communication protocol into our collection of Data Adaptors
You do not need to have a sophisticated communication, hardware or software infrastructure in place to capture, save and analyze your data. rIoT Technology allows you to interface with your assets individually and push data to Power BI. You can scale up this architecture easily as you start adding other assets to the picture
Some Useful Exercises with the Data in Power BI
Power BI is one of the most powerful analytics services in the industry. Going over all of its features is certainly outside the scope of this tutorial. However, we explain some of the basic features that can be used in analyzing the realtime data collected in this example
Create a report and add a chart. Create a dashboard and pin the chart to the dashboard. Picture below shows how to define a new chart:

This picture shows the chars being viewed in a dashboard:

You can export the chart data and download as a csv file:

You may send the chart via email or publish it for the public to view:

In the picture below, chart and tabular data are shown next to each other. You can modify the format and see the data and chart side by side.

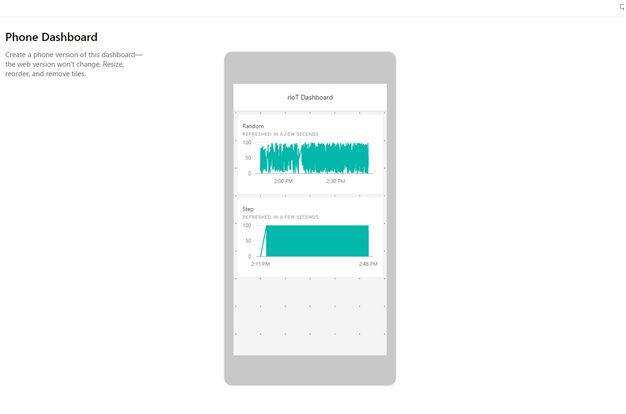
Your dashboards can be viewed in mobile devices. This picture shows a simulation of a mobile device in Power BI:

The following picture shows an actual screenshot of the application running on an Android device:

Power BI support natural language in retrieving and analyzing data. For example, you can create charts and filter them by typing the name of the values and time range.

Next Step
If you are looking into managing your process and field data intelligently, we need to talk. We will help you to model your data, collect and make it available for reporting and analytics. For more information about rIoT Technology, please visit us at www.avistarts.com.


